Educational content only. Not personalised medical advice. Clinical decisions remain the responsibility of the treating clinician.
Global eye health: blindness and vision impairment
In 2020 an estimated 43.3 million people were blind and 295 million had moderate or severe vision impairment (MSVI) worldwide [S7]. Most blindness and MSVI in adults aged 50 years and older comes from cataract and uncorrected refractive error, both reversible [S3] [S6]. Age-standardised prevalence has fallen, but population growth and ageing mean the number of people affected keeps rising [S7] [S11].
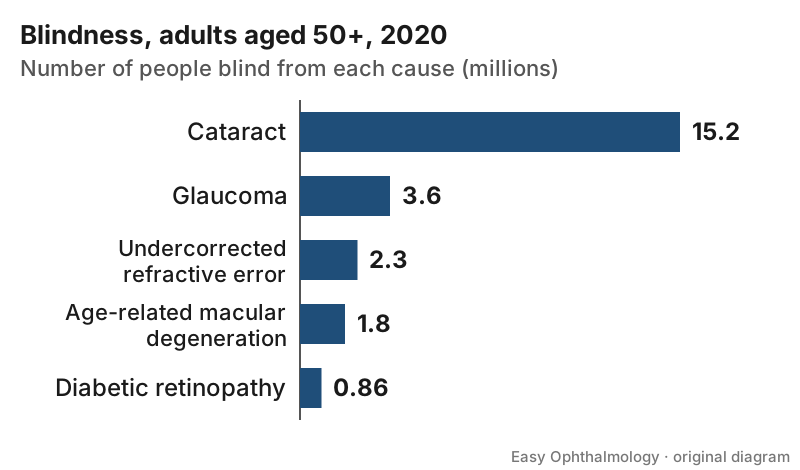
Key points - Cataract was the leading cause of blindness in adults aged 50 years and older in 2020 (15.2 million cases), and undercorrected refractive error the leading cause of MSVI (86.1 million cases) [S6]. - Between 1990 and 2020 the age-standardised prevalence of blindness in adults aged 50 years or older fell by 28.5%, but the number of blind people rose by 50.6% [S7]. - The World Health Assembly target of a 25% reduction in avoidable vision impairment from 2010 to 2019 was not reached [S6]. - Uncorrected presbyopia caused near vision impairment in an estimated 826 million people in 2015, with the greatest burden in rural areas of low-resource countries [S4]. - Vision impairment is consistently associated with lower quality of life, and timely cataract surgery is among the interventions found to improve it [S9].
Evidence last checked: 2026-10-17 (PubMed abstracts).
Red flags: signs that need urgent action
- In a programme: numbers rising while prevalence falls. A falling age-standardised rate can hide a growing caseload; the count of people blind from cataract rose by 29.7% from 1990 to 2020 despite a 27.5% fall in age-standardised prevalence [S11].
- In a programme: MSVI not improving. Eye services appear to have reduced age-standardised avoidable blindness (-15.4%) but not avoidable MSVI (0.5%) [S6].
- In a programme: service disruption. COVID-19 was described in a perspective as threatening the gains of VISION 2020 [S8].
- In a population: unmet near-vision need. Global unmet need for presbyopia correction was estimated at 45% in 2015 [S4].
- In children: no accessible service. In African countries the main barriers to paediatric eye care were availability, accessibility and affordability [S10].
- In a person: presenting acuity below 3/60 in the better eye meets the definition of blindness used in these estimates [S3] [S7].
Recognise it: the size and pattern of the problem
- Definitions (presenting visual acuity): mild vision impairment ≥6/18 and <6/12; MSVI <6/18 to 3/60; blindness <3/60 or less than 10° visual field around central fixation; near vision impairment from uncorrected presbyopia, near vision <N6 or <N8 at 40 cm with best-corrected distance acuity ≥6/12 [S7].
- 2020 numbers: 43.3 million blind, 295 million with MSVI, 258 million with mild vision impairment and 510 million with vision impairment from uncorrected presbyopia; 55% of each group was estimated to be female [S7].
- Causes of blindness, age 50+, 2020: cataract (15.2 million), glaucoma (3.6 million), undercorrected refractive error (2.3 million), age-related macular degeneration (1.8 million) and diabetic retinopathy (0.86 million) [S6].
- Cataract: in 2020, 17.0 million people (39.6% of the blind) were blind and 83.5 million (28.3% of MSVI) had MSVI due to cataract; its share of blindness was highest in South Asia (62.9%) and Southeast Asia and Oceania (47.9%) [S11].
- Regional and sex differences: high-income subregions had a low share of cataract and a high share of age-related macular degeneration (>14% of blindness) [S3]. Vision loss from diabetic retinopathy and cataract was more common in women, and from glaucoma and corneal opacity more common in men [S3].
- Earlier trend drivers: from 1990 to 2015 the number of blind people rose by 17.6%, driven by population growth (38.4%) and ageing (34.6%) and partly offset by falling age-specific prevalence (-36.7%) [S2].
- Infectious and nutritional causes: in low-income countries, age-standardised prevalence of vitamin A deficiency, onchocerciasis and trachoma fell between 1990 and 2017 [S8].
- Myopia: an estimated 4758 million people (49.8% of the world population) may have myopia and 938 million high myopia by 2050 [S1].
- Forecasts: 61.0 million blind and 474 million with MSVI by 2050 [S7].
Confirm it: how burden is measured
- Global estimates come from systematic reviews and meta-analyses of population-based surveys, using hierarchical models [S6] [S7].
- They use presenting visual acuity, so they capture impairment from uncorrected refractive error as people actually live [S2] [S7].
- Data for younger ages are sparse, so the cause analysis focused on adults aged 50 years and older [S6].
- Presbyopia correction coverage was modelled from country-level variables (Human Development Index, Gini coefficient, health expenditure) [S4].
Manage it: what to do at each resource tier
Before acting on this section, check the national and local guidelines, product information and regulatory approvals that apply where you practise. See the medical disclaimer.
Tier A (primary care / no specialist)
- Measure presenting distance and near acuity, using the thresholds above to identify mild impairment, MSVI and blindness [S7].
- Treat refractive error as reversible with spectacle correction, and cataract as reversible with surgery [S3]; near-vision correction addresses the largest single group with impairment [S4] [S7].
- Ask about barriers (cost, distance, knowledge, beliefs), especially for children [S10].
Tier B (general eye clinic)
- Prioritise cataract surgery and refractive services: together cataract and uncorrected refractive error caused 55% of blindness and 77% of vision impairment in adults aged 50 years and older in 2015 [S3].
- Plan for more patients each year, not fewer, as the population ages [S7] [S11].
- Use quality of life as an outcome: timely cataract surgery and anti-VEGF therapy improve it [S9].
Tier C (specialist centre and planners)
- Use national and regional cause data to direct resources; cataract surgical capacity needs "more, better-directed" resources [S11].
- Track MSVI as well as blindness, since MSVI has not improved [S6].
- Build sustainable eye care systems; lack of ophthalmologists, education and access are major obstacles in developing countries [S5].
- Plan for myopia-related complications as prevalence rises [S1].
Refer when
| Situation | Urgency |
|---|---|
| Sudden loss of vision, painful red eye or eye injury | Same-day to an eye service |
| Presenting acuity <3/60 or <6/18 that does not improve with spectacles or pinhole | Routine to an eye clinic; timing per your local service or specialist advice |
| Child with reduced vision | Urgent to a child eye service; timing per your local service or specialist advice |
Pitfalls
- Reading falling age-standardised prevalence as a falling workload [S7] [S11].
- Measuring only blindness and ignoring MSVI and near vision [S4] [S6].
- Overlooking rural populations, where uncorrected presbyopia is most common [S4].
- Treating barriers as purely clinical; cost, access and beliefs matter [S10].
- Relying on one global figure; causes differ markedly by region [S3].
Evidence notes
| Source | Date | Design |
|---|---|---|
| [S1] | 2016 | Systematic review and meta-analysis with projections (myopia) |
| [S2] | 2017 | Systematic review and meta-analysis (prevalence, 2015) |
| [S3] | 2017 | Systematic review and meta-analysis (causes, 288 studies) |
| [S4] | 2018 | Systematic review, meta-analysis and modelling (presbyopia) |
| [S5] | 2020 | Narrative review |
| [S6] | 2021 | GBD systematic review and meta-analysis (causes, 2020) |
| [S7] | 2021 | GBD systematic review and meta-analysis (prevalence, 2020) |
| [S8] | 2021 | Perspective with database analysis |
| [S9] | 2021 | Umbrella review of systematic reviews |
| [S10] | 2021 | Systematic review, 29 studies from 10 African countries |
| [S11] | 2024 | GBD systematic review and meta-analysis (cataract) |
- All burden figures are modelled estimates with wide uncertainty intervals; the 2017 estimates used 80% intervals and the 2021 estimates 95% intervals, so they are not directly comparable [S2] [S7].
- The 2015 and 2020 figures come from different model rounds; read trends within one round [S2] [S7].
- The GBD analyses were funded by eye-health charities, foundations and an institute [S6] [S7].
- [S5] and [S8] are a narrative review and a perspective (expert opinion).
- The search returned no Lancet Global Health Commission abstract, so the Commission is not summarised here.
- Not covered by these sources: effective coverage indicators, costs of eye care, and the WHO World report on vision.
Related articles
- Effective cataract surgical coverage and outcomes
- The eye care workforce and task sharing
- Integrating eye care into primary health care
References
See the numbered source list below. Each marker [S#] links to its PubMed and DOI record.
Sources
- [S1] Holden BA, Fricke TR, Wilson DA, Jong M, Naidoo KS, Sankaridurg P, et al. Global Prevalence of Myopia and High Myopia and Temporal Trends from 2000 through 2050. Ophthalmology. (2016). PubMed 26875007 · doi:10.1016/j.ophtha.2016.01.006
- [S2] Bourne RRA, Flaxman SR, Braithwaite T, Cicinelli MV, Das A, Jonas JB, et al. Magnitude, temporal trends, and projections of the global prevalence of blindness and distance and near vision impairment: a systematic review and meta-analysis. The Lancet. Global health. (2017). PubMed 28779882 · doi:10.1016/s2214-109x(17)30293-0
- [S3] Flaxman SR, Bourne RRA, Resnikoff S, Ackland P, Braithwaite T, Cicinelli MV, et al. Global causes of blindness and distance vision impairment 1990-2020: a systematic review and meta-analysis. The Lancet. Global health. (2017). PubMed 29032195 · doi:10.1016/s2214-109x(17)30393-5
- [S4] Fricke TR, Tahhan N, Resnikoff S, Papas E, Burnett A, Ho SM, et al. Global Prevalence of Presbyopia and Vision Impairment from Uncorrected Presbyopia: Systematic Review, Meta-analysis, and Modelling. Ophthalmology. (2018). PubMed 29753495 · doi:10.1016/j.ophtha.2018.04.013
- [S5] Williams LB, Prakalapakorn SG, Ansari Z, Goldhardt R Impact and Trends in Global Ophthalmology. Current ophthalmology reports. (2020). PubMed 32837802 · doi:10.1007/s40135-020-00245-x
- [S6] GBD 2019 Blindness and Vision Impairment Collaborators, Vision Loss Expert Group of the Global Burden of Disease Study Causes of blindness and vision impairment in 2020 and trends over 30 years, and prevalence of avoidable blindness in relation to VISION 2020: the Right to Sight: an analysis for the Global Burden of Disease Study. The Lancet. Global health. (2021). PubMed 33275949 · doi:10.1016/s2214-109x(20)30489-7
- [S7] GBD 2019 Blindness and Vision Impairment Collaborators, Vision Loss Expert Group of the Global Burden of Disease Study Trends in prevalence of blindness and distance and near vision impairment over 30 years: an analysis for the Global Burden of Disease Study. The Lancet. Global health. (2021). PubMed 33275950 · doi:10.1016/s2214-109x(20)30425-3
- [S8] Ung L, Jonas JB, Lietman TM, Chodosh J COVID-19 and the Unfinished Agenda of VISION 2020. American journal of ophthalmology. (2021). PubMed 33309690 · doi:10.1016/j.ajo.2020.11.016
- [S9] Assi L, Chamseddine F, Ibrahim P, Sabbagh H, Rosman L, Congdon N, et al. A Global Assessment of Eye Health and Quality of Life: A Systematic Review of Systematic Reviews. JAMA ophthalmology. (2021). PubMed 33576772 · doi:10.1001/jamaophthalmol.2021.0146
- [S10] Alrasheed SH A systemic review of barriers to accessing paediatric eye care services in African countries. African health sciences. (2021). PubMed 35283961 · doi:10.4314/ahs.v21i4.47
- [S11] Vision Loss Expert Group of the Global Burden of Disease Study, GBD 2019 Blindness and Vision Impairment Collaborators Global estimates on the number of people blind or visually impaired by cataract: a meta-analysis from 2000 to 2020. Eye (London, England). (2024). PubMed 38461217 · doi:10.1038/s41433-024-02961-1